Strikeline Join the waitlist
← All indicatorsFree · Live on TradingView

Options Strike Probability Map [Strikeline]

Which strikes are realistic today, and which are lottery tickets?

The question it answers
Which strikes are realistic today, and which are lottery tickets?
What it draws
Three key strikes above price (calls) and three below (puts): likely, stretch and edge, each with the odds the options market is pricing for it.
Data
Option prices from OPRA via TradingView. Free data is delayed about 15 minutes; nothing else to buy.
Plan
Free
Version
v0.2
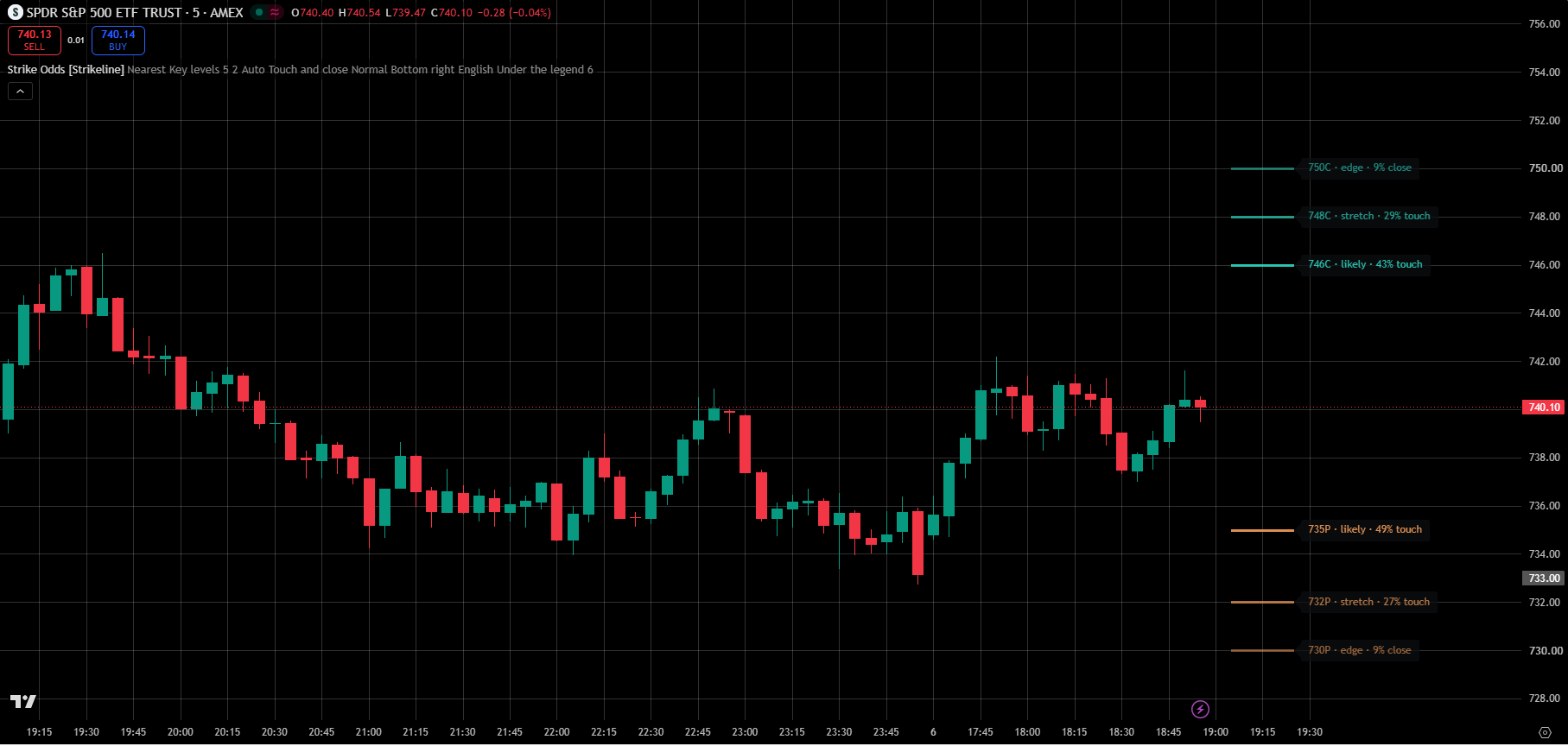
Options Strike Probability Map on a TradingView chart

How it works

Every option price hides a probability. This indicator turns the at-the-money straddle into the odds that price reaches each strike before expiration, or finishes beyond it, and keeps only the three strikes on each side that answer a real question.

Likely: about a coin-flip chance to be touched — a realistic first target. Stretch: about 1 in 3 — reached on stronger days. Edge: the first strike with under 10% chance to finish in the money — contracts beyond it are cheap for a reason.

Touch and close are different. A strike can be touched intraday and still expire worthless; the chance of touching is roughly twice the chance of closing beyond it. Targets use the touch odds, the edge uses the close odds.

Step by step

  1. Add it to your chartIn TradingView open Indicators, search “Options Strike Probability Map” and click it. Use SPY, QQQ, SPX or a liquid stock on a 2- to 15-minute chart.
  2. Read the likely strikesThe strikes marked “likely” are where the market gives about even odds of a touch before expiration — realistic first targets on a normal day.
  3. Check the stretch“Stretch” needs a stronger-than-usual day. Buying a contract there means betting on that kind of day.
  4. Respect the edgeBeyond the “edge” strike, options have under 10% chance to finish in the money. Cheap, but cheap for a reason.
  5. Mind the delayFree OPRA data on TradingView is about 15 minutes late; the odds update with the delayed straddle.

Best timeframe

HorizonChart timeframeWhy
Nearest (0DTE)2-min to 5-minToday’s odds change fast; short frames show each strike being tested.
Weekly15-min to 1-hourThe odds run to Friday.
Monthly1-hour to dailyFor monthly options and strike choice on longer trades.

The math

σ√T ≈ ATM straddle ÷ (0.8 × price) · Close beyond = N(−|ln(K ÷ price)| ÷ σ√T) · Touch ≈ 2 × close beyond

No drift and a lognormal model, the same assumptions option prices are built on. If option prices are missing it falls back to the volatility index (VIX1D for SPY/SPX, VXN for QQQ, RVX for IWM, VIX for the rest) or 20-day historical volatility.

Settings

SettingWhat it does
Strikes shownKey levels (default): three strikes each side with their role. All strikes: every listed strike in the range with both numbers.
ExpirationNearest (today for SPY/QQQ/IWM/SPX, the next Monday, Wednesday or Friday for big stocks with those expirations, Friday for the rest), Weekly or Monthly.
Strikes each side + Range to coverOnly for “All strikes”: how many strikes and how many expected moves they span.
Listed strike spacingAuto, or the stock’s strike spacing, used to find the straddle and round the strikes.
Show readingOff by default. One plain-language line under the indicator list, in English, Arabic, Spanish or Turkish.
Show dashboardOff by default. Volatility source, the move priced in, and the 30% touch and 10% close strikes.

Worked examples

Reading the chart: SPY, Friday 6 Nov 2026, 10:56 New York
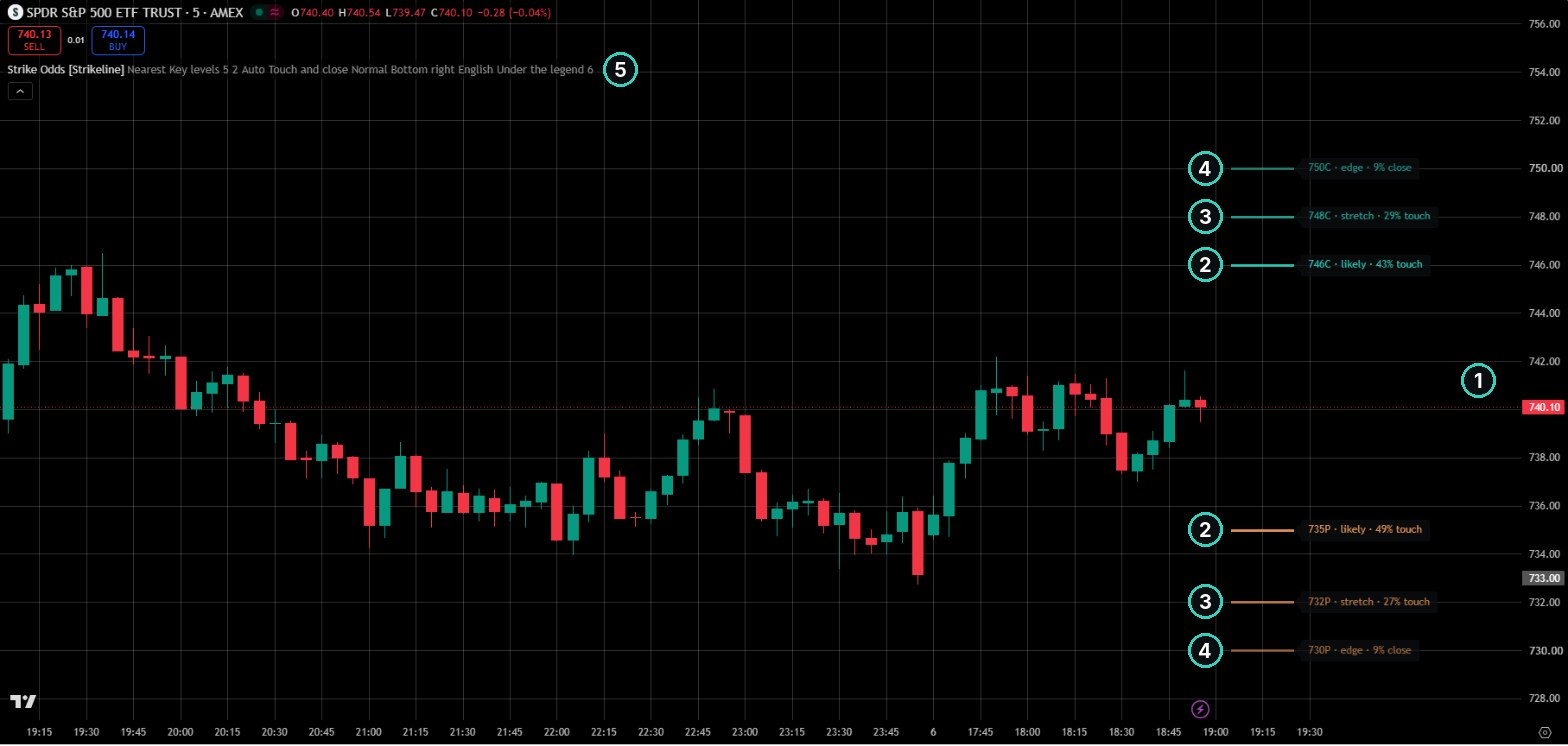
SPY 5-minute chart on 6 Nov 2026 with Options Strike Probability Map, numbered callouts

1 — Price: 740.10. Every number on the chart is measured from here, using today’s at-the-money straddle.

2 — Likely: 746 call and 735 put. The market gives each one a bit under a coin flip to be touched before today’s close (43% and 49%). Realistic first targets on a normal day.

3 — Stretch: 748 call and 732 put, about 1 in 3 to be touched (29% and 27%). Price gets there on a stronger-than-usual day; buying these is a bet on that kind of day.

4 — Edge: 750 call and 730 put, 9% to finish in the money. Contracts beyond them are cheap because the market rarely pays them out.

5 — The indicator name and its settings. Nothing to set: the expiration, the strikes and the volatility are picked automatically. The reading line and the dashboard are off by default.

How traders use it

  • Buyers check that their strike is at or inside “likely” for a normal day; beyond “stretch” they need a strong reason.
  • Sellers often place short strikes beyond “edge”, where the market prices under 10% to finish in the money.
  • Pair it with IV Sigma Levels Lite: if “likely” sits near ±1σ, the options and the volatility index agree on the day’s size.

Good to know

  • These are the market’s prices turned into odds, not a forecast. Real moves have fatter tails than the model.
  • Free OPRA data on TradingView is delayed about 15 minutes.
  • Educational tool. Not a signal and not financial advice.

Changelog

Version
0.2Key levels view by default (likely, stretch, edge); reading line off by default.
0.1First build: touch and close odds per strike from the ATM straddle, volatility fallback, dashboard, reading line.