Lesson 1 · 6 min read
What is the expected move?
The range the options market prices for a stock until a given date — and how to read it on your chart.
The short answer
The expected move is the range the options market is pricing for a stock between now and a date — usually an option expiration.
It is a 1-standard-deviation (1σ) range: about two times out of three, price finishes inside it. It says nothing about direction — only how far.
Where the number comes from
Options are priced on how much the market thinks a stock will move. That expectation is called implied volatility (IV). Turn it into price points with one formula:
Expected move (1σ) = price × IV × √(trading days ÷ 252)
Example — SPY on Monday 26 Oct 2026: Friday’s close was 759.97 and VIX1D (the one-day implied volatility of the S&P 500) was 16.8%. 759.97 × 0.168 × √(1 ÷ 252) ≈ ±8.05 points. So the market expected Monday to finish between about 751.92 and 768.02.
There is a second, more direct way: the price of the at-the-money straddle (call + put at the strike nearest to price). On the same day the SPY 0DTE straddle cost 6.06 — the move option sellers were charging for. A straddle is worth about 0.8σ, so the two numbers tell the same story.
Reading it on a chart
Here is that Monday with the levels drawn. The dashed line is the anchor (Friday’s close); the solid lines are ±1σ; the thin dotted lines are ±0.5σ.
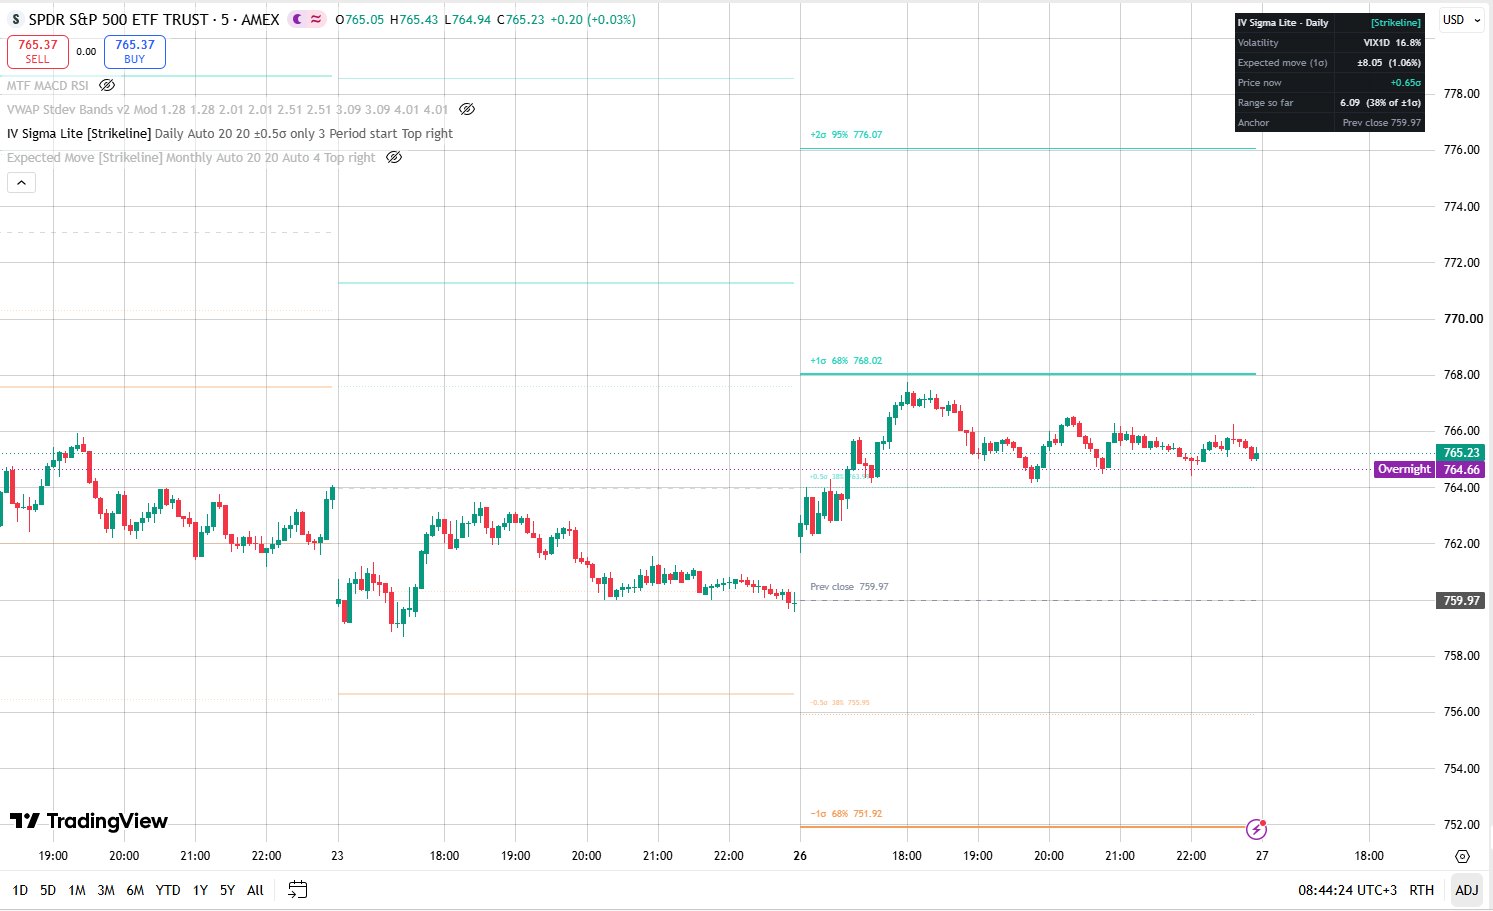
Price opened above the anchor, broke +0.5σ in the first hour and ran to 767.78 — just 0.24 under +1σ at 768.02. The edge of the expected move acted as the ceiling. In the afternoon every dip held at +0.5σ, and the day closed at 765.23: inside the range.
More time, bigger range — but not in proportion
The move grows with the square root of time, not with time itself. A week is five times longer than a day, but its expected move is only √5 ≈ 2.2 times bigger.
This is why a weekly range is not five daily ranges stacked together, and why far-dated options do not cost proportionally more.
What it is not
- Not a target. Price does not have to reach the edges.
- Not a direction call. The range is symmetric around the anchor.
- Not a guarantee. About one cycle in three finishes outside ±1σ, and real markets have more extreme days than the math assumes.
- Not fixed around events. Before earnings the expected move is wider; right after, it usually shrinks (the “IV crush”).
How traders use it
- Option buyers check whether their strike sits inside the range. A strike beyond it needs a bigger-than-expected move.
- Option sellers place short strikes outside the range and let time work.
- Day traders treat ±1σ as the edge of a normal day: near it, chasing gets risky and reactions are common.
- Everyone watches how much of the move is used. If a day has already covered its whole expected range by noon, the easy part is likely done.
Key takeaways
- Expected move = the 1σ range priced by options until a date; about 68% of outcomes land inside.
- Formula: price × IV × √(days ÷ 252). Or read it straight from the at-the-money straddle.
- It grows with √time: a week ≈ 2.2 days’ worth, a month ≈ 4.6.
- Use it as a map — edges, not targets.
See it on your chart
Options IV Sigma Levels Lite
How far can price travel today, this week or this month — and where is it stretched?
Free · In testingOptions Expected Move Bands
How far can price move before this week’s (or this month’s) options expire?
Free · In testingOptions ATM Straddle Implied Move
What move is priced into this stock’s own options?