SPX today · SPX now 7,054 (−1.7%)
SPX: a fast squeeze to 7,199 failed, support broken
Updated: Friday 20 November at 19:52 (Riyadh time)
⚠️ Educational content only. This is not an investment recommendation or financial advice, and it is not a signal to buy or sell. Markets can move against any scenario; do your own research and manage your own risk.
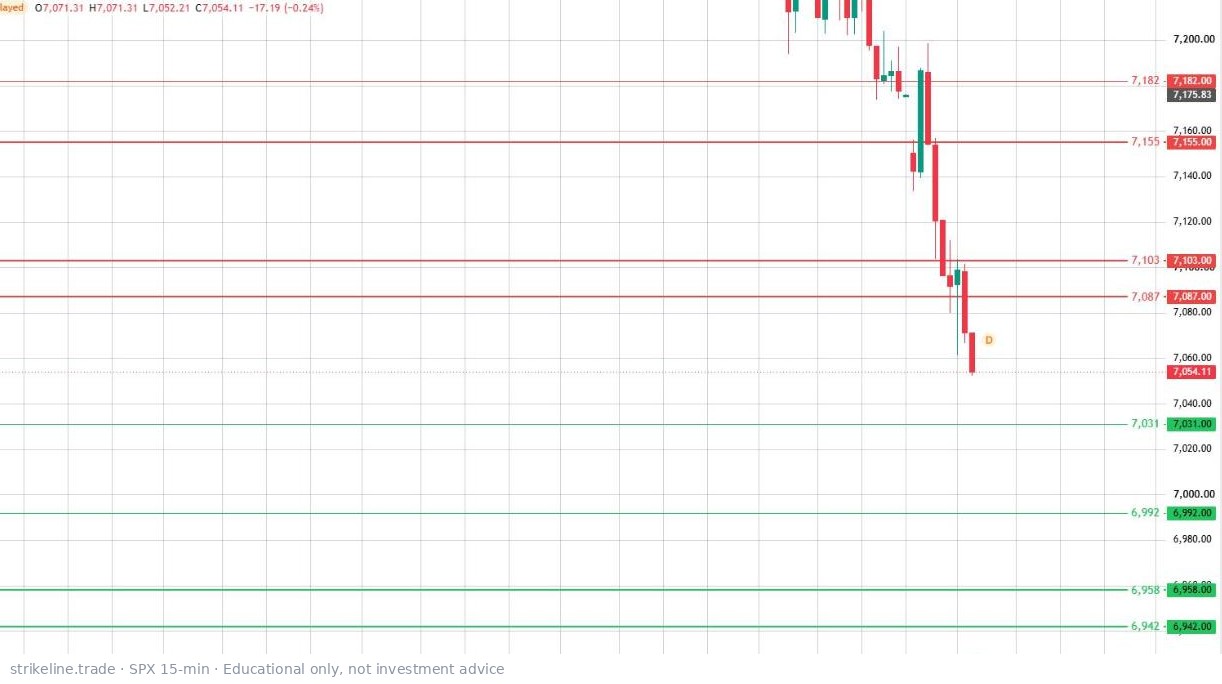
Chart: SPX 15-minute (today). Chart: red lines = resistance, green = support, yellow = pivot. Orange path = main scenario, dashed grey = alternative.
The picture
- SPX jumped to 7,199 after the open, then fell about 145 points and broke the strong 7,087–7,103 support; it trades near 7,054, down about 1.7%.
- The trend is clearly down: the broken 7,087–7,103 zone is now resistance.
- Monthly options expiry is adding to the swings in both directions.
Today
- Main: bounces stay under 7,087–7,103, then a slide toward 7,031 into the close.
- Alternative: price climbs back above 7,103 and holds, toward 7,155.
- A break below 7,031 opens 6,992, then the strong 6,942–6,958.
The next five sessions
- Mon: pressure toward 7,031–6,992; a break opens 6,942–6,958.
- Tue–Wed (short holiday week): a rebound attempt toward 7,087–7,103.
- Expected range for the week: roughly 6,820 to 7,410.
The week in one minute
What moved the market from Nov 16 to 20, day by day.
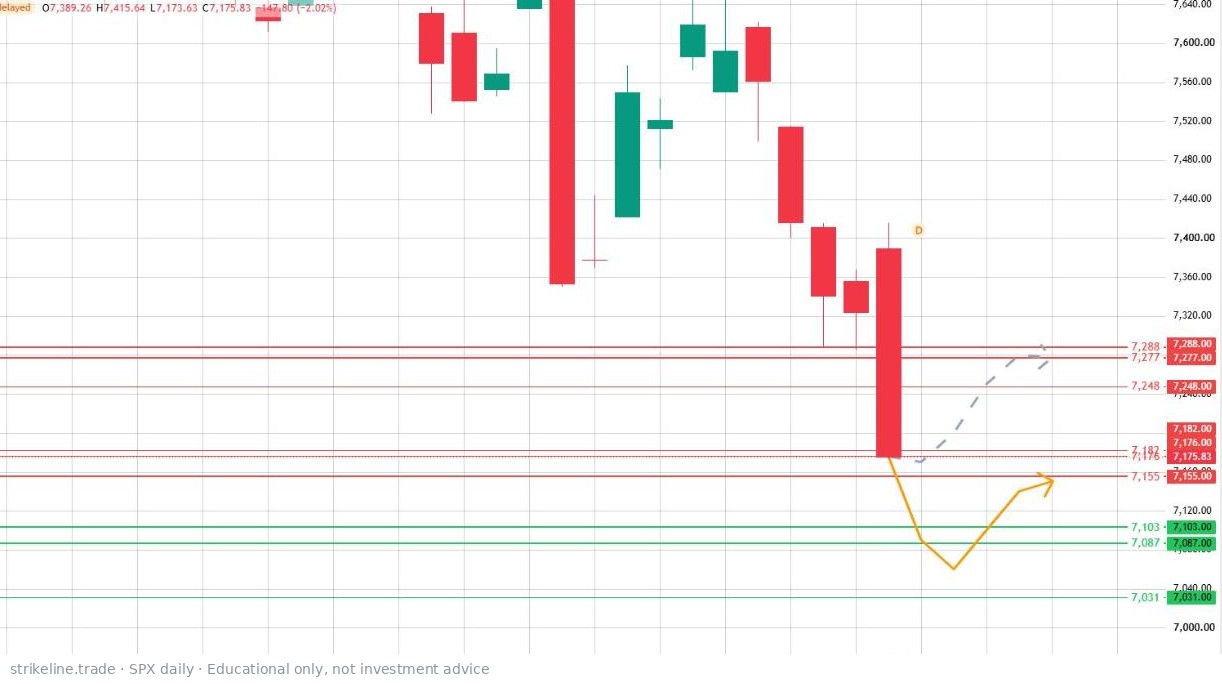
Chart: SPX daily (the next five sessions).
Levels, top to bottom
| Level | Role |
|---|---|
| 7,155 | Resistance · strong |
| 7,087 – 7,103 | Resistance · strong |
| 7,031 | Support |
| 6,992 | Support |
| 6,942 – 6,958 | Support · strong |
When the view is wrong
The bearish view is wrong if a 15-minute candle closes above 7,110; the next target is then 7,155.
⚠️ Educational content only. This is not an investment recommendation or financial advice, and it is not a signal to buy or sell. Markets can move against any scenario; do your own research and manage your own risk.